Written by: JJ Tan, Founder, Jelly
Key Takeaways
- UK pub operators face sustained cost pressure with 4.0% inflation in restaurants and hotels, so accurate menu costing now protects margin.
- A pub menu cost calculator converts invoice prices into net revenue ex-VAT, portion cost with wastage, food cost percentage, and gross profit percentage to guide pricing decisions.
- The worked burger example shows how a 20% beef price increase moves food cost from 16.2% to 19.5%, which prompts a hold, switch, or re-price decision against the 28–32% target range.
- UK pubs should target 28–32% food cost and 68–72% GP for wet-led formats, with food cost above 35% signalling the need for immediate menu action.
- Jelly automates invoice scanning, live dish costing, and real-time margin visibility so UK pub operators can make pricing decisions the same week supplier prices change.
See Live Dish Margins For Your Pub Menu
Quick Overview: What A Pub Menu Cost Calculator Actually Does
A pub menu cost calculator converts raw ingredient costs, drawn from supplier invoices, into four outputs that show whether a dish earns its place on the menu. Those outputs are net revenue ex-VAT, portion cost including wastage, food cost percentage, and gross profit percentage. Generic spreadsheet tools usually return a single food cost number, which hides the VAT position, the wastage assumption, and the contribution margin in pounds.
The three core formulas, with UK VAT at 20% stated explicitly:
- Net Revenue Ex-VAT: menu price ÷ 1.20
- Food Cost %: (portion cost including wastage ÷ net revenue ex-VAT) × 100
- GP %: ((net revenue ex-VAT − portion cost including wastage) ÷ net revenue ex-VAT) × 100
The calculation framework runs in sequence: invoice price → portion cost with wastage → net revenue ex-VAT → food cost % → GP % → menu price decision.
UK Pub Benchmarks (2026)
- Target food cost range: 28–32% for wet-led or community pubs with a simple food offer
- Target GP range: 68–72%
- Red flag threshold: for UK food pubs, food cost above 35% requires menu re-pricing or ingredient cost reduction
Treat these as reference ranges. A dish at 33% food cost is fine, while a dish at 37% for three consecutive invoice cycles needs re-pricing. Food cost % and food GP % are arithmetic inverses and sum to 100% when both use the same net revenue excluding VAT.
Check Your Menu Against UK GP Benchmarks
Worked Example: One Pub Burger From Invoice To Menu Price
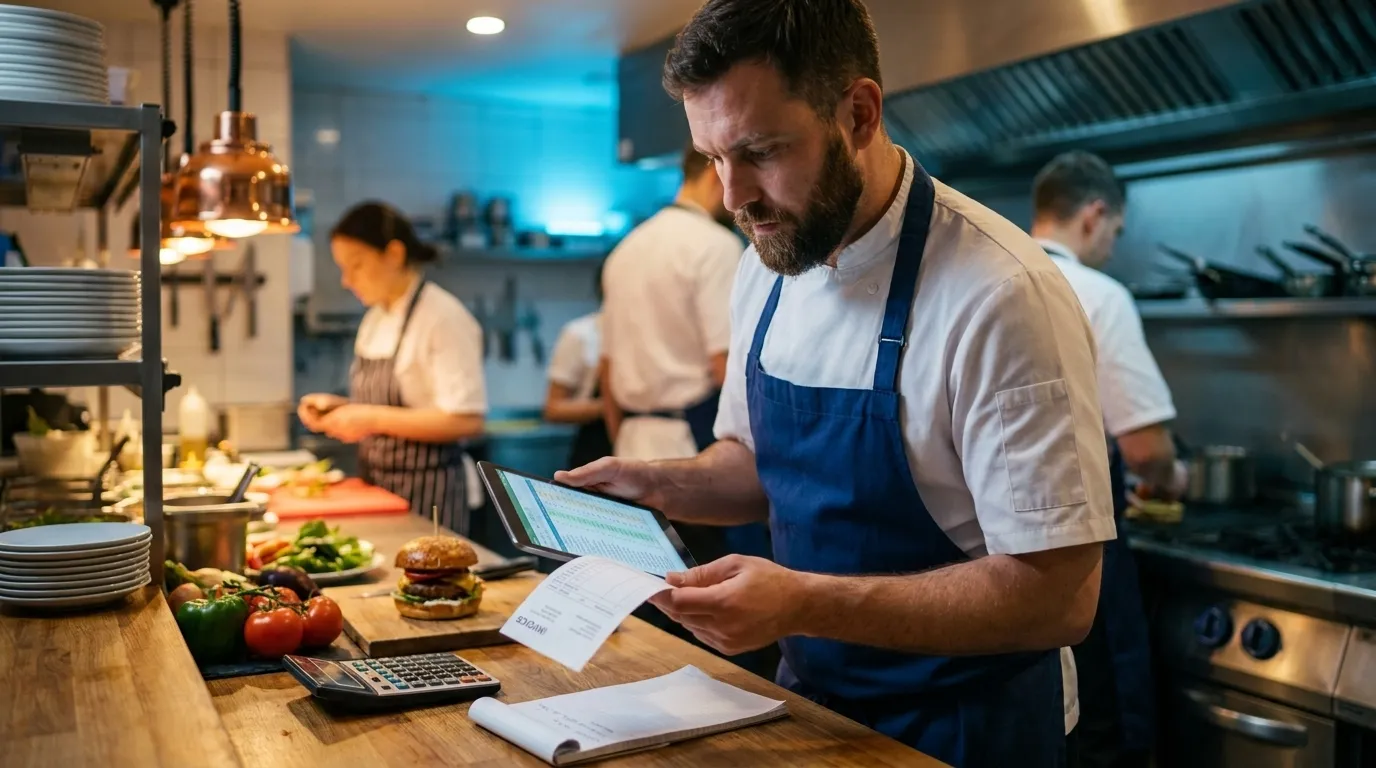
This example carries a pub burger from invoice line to menu price decision and shows each step clearly.
Step 1: Invoice Price And Portion Cost
Beef mince: £8.50/kg from a chilled protein supplier. Portion size: 200g. Raw portion cost: £8.50 × 0.200 = £1.70.
Step 2: Apply 10% Wastage
Wastage allowance: 10% for trim, cooking loss, and prep waste. Portion cost including wastage: £1.70 ÷ 0.90 = £1.8888…, which rounds to £1.89.
Step 3: Net Revenue Ex-VAT
Menu price: £14.00. HMRC confirms that food supplied for consumption on pub premises, including outdoor seating such as beer gardens, is standard-rated at 20% VAT. Net revenue ex-VAT: £14.00 ÷ 1.20 = £11.67.
Step 4: Food Cost % And GP %
Food cost %: £1.89 ÷ £11.67 × 100 = 16.2%. GP %: (£11.67 − £1.89) ÷ £11.67 × 100 = 83.8%.
At £14.00, this burger sits well inside the 28–32% food cost target on the beef component. The bun, sauce, garnish, and sides still need to be added. A fully loaded burger with all components typically lands at 28–32% food cost at this price point. The calculation above covers the beef mince only, so every ingredient must be costed and summed for an accurate dish-level food cost.
Mid-Quarter Supplier Price Increase Scenario
Beef mince rises from £8.50/kg to £10.20/kg mid-quarter. Recalculation:
- Raw portion cost: £10.20 × 0.200 = £2.04
- Portion cost with 10% wastage: £2.04 ÷ 0.90 = £2.27
- Net revenue ex-VAT: £11.67 (menu price unchanged at £14.00)
- Food cost % (beef mince only): £2.27 ÷ £11.67 × 100 = 19.5%
A 20% increase in beef mince price adds 3.3 percentage points to the beef mince food cost alone. When all burger components are included, the fully loaded dish food cost will move toward or beyond the 32% upper benchmark.
The decision follows from the blended dish food cost. If it stays below 32%, hold. If an equivalent specification is available cheaper, switch supplier. If neither option works, re-price the burger to £15.00 (net revenue ex-VAT: £12.50) to restore margin without a full menu overhaul. At a £15.00 net (ex-VAT) menu price, a beef mince dish costing £4.20 per portion would sit at 28.97% food cost, which falls inside the target range.
The hold, switch, or re-price decision needs to happen the same week the invoice arrives, before the next service.
Five-Step Process To Cost A UK Pub Menu
- Capture Every Invoice Line Item Accurately. Start with the invoice, because every later number depends on it. Record quantity, SKU, price, and tax for every delivery. Missing a line item or rounding a price creates a cost baseline that flatters GP and delays re-pricing decisions.
- Build Dish Recipes With Portion Sizes And Wastage. Each recipe should specify the as-served weight of every ingredient, the usable yield after trim and cooking loss, and a wastage percentage. A 200g beef mince portion with 10% wastage has a true cost based on 222g of raw mince purchased.
- Calculate Net Revenue Ex-VAT And GP% For Each Dish. Strip VAT by dividing the menu price by 1.20. Use net revenue ex-VAT as the denominator for all food cost and GP calculations. Subtracting 20% from the menu price instead of dividing by 1.20 produces a 47p error on a £14.00 dish, which flatters GP on every cover.
- Set Menu Prices To Hit Target GP. Work backwards from the target food cost percentage: menu price ex-VAT = portion cost ÷ target food cost %. Multiply by 1.20 to arrive at the VAT-inclusive menu price. For a fully loaded burger with a £3.50 portion cost and a 30% food cost target, ex-VAT price = £3.50 ÷ 0.30 = £11.67 and VAT-inclusive menu price = £11.67 × 1.20 = £14.00.
- Monitor Supplier Price Changes And Re-Price When Needed. A dish costed eighteen months ago reflects a different market. Recalculate food cost % and GP % when a supplier invoice price changes by more than roughly 5%, or when a dish’s food cost percentage rises more than 2–3% above target, and make the hold, switch, or re-price call before the next service.
Seven Practical Menu Pricing Methods For UK Pubs
- Cost-Plus Pricing. Calculate portion cost and add a target markup to reach the required food cost percentage. This method sets the margin floor but ignores what customers are willing to pay. It suits all pub formats as a baseline.
- Gross Profit Margin Pricing. Set price so that GP% hits a target, typically 68–72% for a UK pub food dish. Work directly from the GP formula: menu price ex-VAT = portion cost ÷ (1 − target GP%). This method suits food-led pubs where GP% is the primary management metric.
- Contribution Margin Pricing. Set price so that each dish covers a fixed pound contribution to labour, overhead, and profit. Menu price = ingredient cost + required contribution margin per cover. This method suits pubs with high fixed overhead, because every dish carries a defined pound recovery.
- Value-Based Pricing. Set price according to what the customer believes the dish is worth, based on the pub’s positioning, service quality, and local market. A gastropub burger can command a higher price than a community local’s burger even with identical ingredient costs.
- Competition-Based Pricing. Use competitor menu prices as a reference point. Matching the cheapest competitor’s price means matching their margins, which may not suit your rent, labour, and ingredient costs. This method works well for commodity dishes such as fish and chips or a Sunday roast.
- Psychological Pricing. Price at £13.95 rather than £14.00 for casual food items and use round numbers for premium dishes. Place the most expensive item at the top of each menu section so everything below reads as better value. Psychological pricing enhances sound economics.
- Dynamic Pricing. Adjust prices based on demand, time of day, or day of week, such as a lower price on a Monday burger special to drive midweek covers. This method suits food-led pubs with POS integration more than wet-led locals where price consistency forms part of the offer.
For a pub burger, cost-plus and gross profit margin pricing establish the floor. Value-based and psychological pricing then determine where the final menu price sits above that floor. Dynamic pricing becomes most relevant for food-led multi-site operators with POS data by daypart.
How To Cost A Pub Dish With VAT And Wastage
Whichever pricing method you choose, the arithmetic only works when VAT and wastage are handled correctly. HMRC’s hospitality VAT guidance confirms that the UK standard rate of 20% applies to all food and drink prepared for catering or consumed on premises, including meals eaten in a pub. Cold takeaway food eaten elsewhere is usually zero-rated for VAT when it is not one of the always standard-rated categories, such as potato crisps, sweets, some beverages including bottled water, and it is not eaten in a designated area. In the UK, crisps, confectionery, ice cream, soft drinks, and alcohol always carry 20% VAT regardless of how they are sold.
Stripping VAT correctly matters. A £14.00 menu price divided by 1.20 gives £11.67 net revenue ex-VAT. Subtracting 20% instead gives £11.20, a 47p difference per dish. On 200 burger covers a week, that error overstates net revenue by £94 per week and flatters GP by roughly 0.4 percentage points. Over a year, the distortion becomes significant.
Applying wastage correctly: 200g portion at £8.50/kg = £1.70 raw portion cost. With 10% wastage: £1.70 ÷ 0.90 = £1.8888…, which rounds to £1.89 as the portion cost including wastage.
Recalculating with the wastage-inclusive portion cost:
- Net revenue ex-VAT: £14.00 ÷ 1.20 = £11.67
- Food cost % (beef mince): £1.89 ÷ £11.67 × 100 = 16.2%
- GP % (beef mince contribution): (£11.67 − £1.89) ÷ £11.67 × 100 = 83.8%
Using the raw portion cost of £1.70 instead of the wastage-inclusive £1.89 understates food cost by 1.6 percentage points on the beef mince alone. Across a fully loaded burger with multiple ingredients, omitting wastage from every component produces a food cost that runs too low and a GP that runs too high.
Food Cost Targets For Different UK Pub Formats
UK wet-led or community pubs with a simple food offer should target 28–32% food cost, which gives a 68–72% gross profit margin on food before labour. Food-led pubs and gastropubs can justify 33–38% food cost because the offer supports a higher price point.
For UK food pubs, a food cost percentage above 35% of net (ex-VAT) food revenue acts as a red flag that calls for menu re-pricing or ingredient cost reduction. Food-led pubs and gastropubs can live with 35–38%, while anything above 40% signals a serious control problem. These ranges align with UK hospitality accounting benchmarks and the UK Pub Benchmarks (2026) used throughout this article.
GP% puts food and drink on the same scale, yet a food plate at 64% GP can contribute less cash to a pub’s bottom line than a spirits round at 74% GP. A higher percentage on a lower-priced round can yield less gross profit than a lower percentage on a higher-priced plate. StockTap’s 2026 pub GP benchmark guide states that UK pub food gross profit typically sits at 60–68% on paper before kitchen labour and waste are counted. The food cost percentage benchmark therefore needs to sit alongside the pound contribution per cover.
A 3% creep in food cost percentage can erase the entire net profit of a venue operating on the thin margins typical of independent restaurants, around 3–5% of sales. At a higher 8% operating margin, the same 3 unpassed points would swallow about a third of annual earnings, with roughly 6 points needed to erase them completely. On £500,000 in annual food revenue, a 3-percentage-point food cost increase represents £15,000 in lost margin.
What A Good Pub Menu Cost Calculator Should Output
A pub menu cost calculator should output four values for every dish: net revenue ex-VAT, portion cost including wastage, food cost %, and GP %. A single food cost number hides the VAT position, the wastage assumption, and the contribution margin in pounds.
Without net revenue ex-VAT, the food cost percentage is calculated on the VAT-inclusive price and flatters GP. Without the wastage assumption stated explicitly, two operators using the same invoice price will produce different food cost figures and neither will know why. Without the contribution margin in pounds, a dish with a 28% food cost at an £8.00 VAT-inclusive menu price (net price £6.67, gross profit £4.48 per cover) looks identical in percentage terms to a dish with a 28% food cost at an £18.00 VAT-inclusive menu price (net price £15.00, gross profit £10.80 per cover), even though the second dish contributes more than twice as much to the bottom line.
The burger example above shows the four outputs in practice. The beef mince alone runs at 16.2% food cost and 83.8% GP, based on a £1.89 wastage-inclusive portion cost and £11.67 net revenue ex-VAT. The full dish decision then follows from those four numbers once all components are included.
Food Cost Calculator Excel Vs Pub Menu Cost Calculator
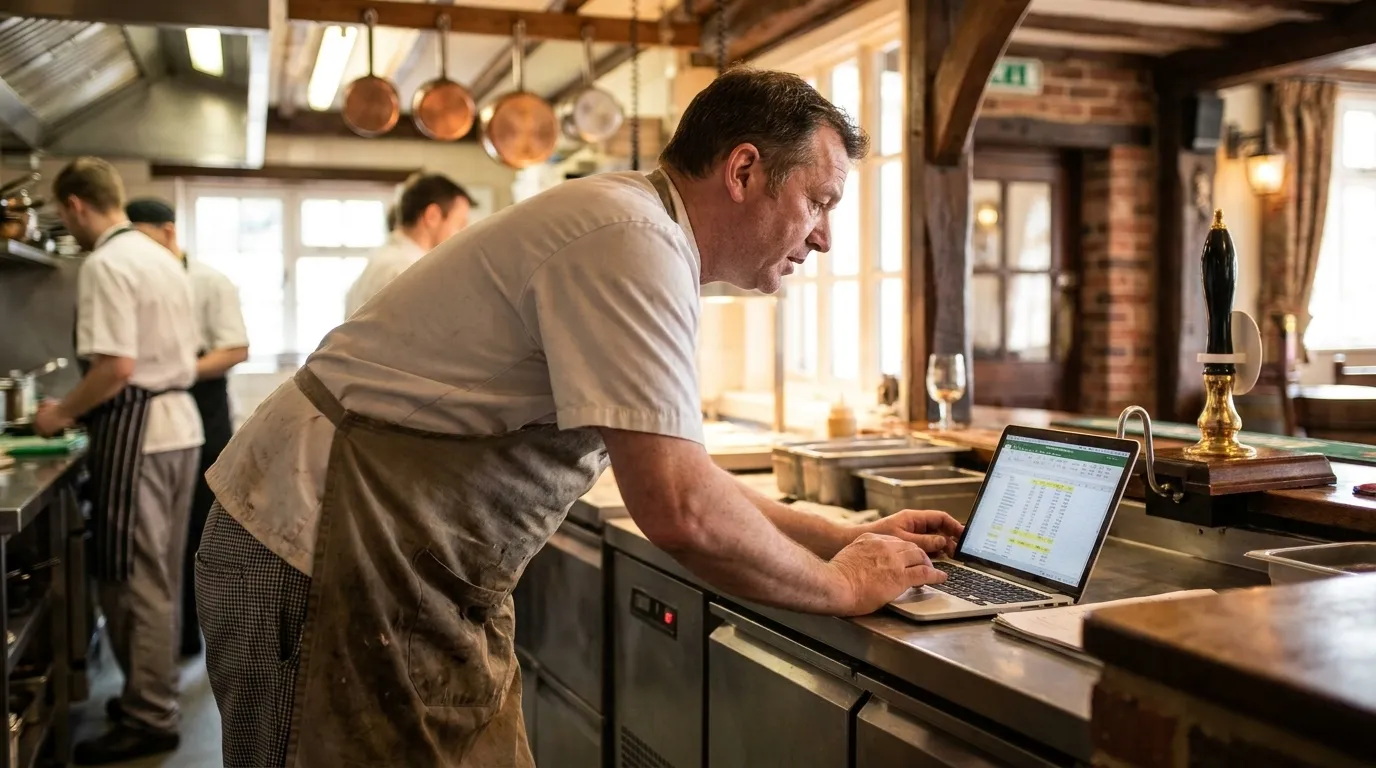
A spreadsheet is manual and static and takes around 28 minutes to cost a single dish. Every time a supplier changes a price, the spreadsheet needs a manual update, which often never happens. A pub menu cost calculator connected to invoices updates ingredient costs automatically with every delivery and shows live GP margins across every dish on the menu.
A spreadsheet costed eighteen months ago reflects a market that has moved on. With beef, dairy, and coffee among the climate-affected foods driving disproportionate food inflation through 2025 and into 2026, according to ECIU’s May 2026 analysis, a static spreadsheet records what margins used to be. The re-pricing window often closes before the monthly accountant’s report arrives. A live system surfaces the price change the same week the invoice lands.
The practical difference: 28 minutes per dish in a spreadsheet versus 3 minutes per dish in a system that pulls ingredient costs directly from scanned invoices. On a 40-dish menu, the admin difference between spreadsheet and system is roughly 1–2 hours for a single global spreadsheet figure versus 18–25 hours to standardise 40 recipes in a system every time prices change.
Common Challenges And Pitfalls In Pub Menu Costing
- Inconsistent Data Capture. Missing invoice line items or manual entry errors produce a cost baseline that cannot be trusted. A food cost figure built on incomplete invoice data will understate true costs and overstate GP.
- Delayed Reporting. Waiting for monthly accountant reports before reacting to supplier price changes means the re-pricing window has already closed. UKHospitality’s procurement briefing identifies this lag as a primary cause of margin leakage in multi-site hospitality businesses.
- Overreliance On Spreadsheets. At 28 minutes per dish, manual costing does not scale for a pub with a 30–50 dish menu and weekly supplier price changes.
- Poor Adoption. Chefs already work at full capacity. When the costing process demands significant manual effort, it will not be completed consistently and kitchen performance data will be inaccurate.
- Fragmented Systems. Invoices, POS, and accounting in separate systems create no single source of truth for dish-level margin. GP figures from the accountant do not match the chef’s spreadsheet because neither pulls from the same invoice data.
- Lack Of Accountability. Nobody clearly owns the margin. The owner may not have chef training and the chef may not have time for office work. Food cost then drifts above 35% before anyone identifies the cause.
A food cost running at 38–40% often comes from over-portioning on the line, supplier pricing that has not been reviewed or repriced into recipes, and recipe cards costed at old prices. That same 38–40% range can still work for protein-heavy formats such as fine dining, steakhouses, and premium pub menus, so it only signals a problem in concepts whose benchmark sits lower.
Five Best-Practice Characteristics Of Modern Pub Menu Costing
Effective pub menu costing approaches share five characteristics.
- Simplicity. The process must be usable by a busy kitchen team without dedicated admin time. When costing a dish takes 28 minutes, it will not be done consistently.
- Timeliness. Margin visibility should be daily or real-time, not monthly. A supplier price change that moves a dish from 30% to 37% food cost needs to be visible the same week.
- Visibility. GP% per dish and per supplier should be accessible to both the head chef and the owner or finance manager. Shared data supports aligned decisions.
- Repeatability. The costing process should produce consistent results across menu changes, seasonal rotations, and supplier switches. A process that depends on one person’s spreadsheet does not meet this test.
- Ease Of Use. Minimal manual effort is the prerequisite for consistent adoption. Automation of invoice capture and ingredient cost updates removes the dependency on kitchen staff completing paperwork.
A quarterly menu engineering review, plotting every dish by food cost % and GP contribution in pounds, can add 2–4 percentage points to food GP for UK pub operators, according to Paddl’s pub revenue growth analysis. That review only works when the underlying cost data is current.
Run A Data-Driven Menu Engineering Review
How Jelly Automates Pub Menu Costing And Reporting
The pitfalls above share a common cause: cost data that is captured late or by hand. Jelly removes that cause for UK pubs, restaurants, and boutique hotels turning over £500k+ that need dish-level margin visibility without heavy admin. The platform automates the full flow from invoice to GP%, so the hold, switch, or re-price decision can be made the same week a supplier price changes.
Jelly’s core capabilities for pub menu costing and reporting:
- Automated Invoice Scanning. Every invoice line item, including quantity, SKU, price, and tax, is captured via photo or email without manual entry. Ingredient costs update in real time with every delivery.
- Live Dish Costing. As invoices update ingredient prices, dish costs and GP margins update automatically. A red percentage flags a dish that has dropped below its margin target, while a green one confirms improvement. What used to take 28 minutes per dish in a spreadsheet takes around 3 minutes in Jelly’s Kitchen section.
- Price Alerts. Every supplier price increase or decrease is flagged immediately, with the size of the change and the supplier clearly shown. Head chefs gain concrete evidence to negotiate credits or switch suppliers before the margin impact compounds.
- Flash Reports. Daily, weekly, or monthly GP margin views are calculated from invoice costs and POS sales data, without waiting for an accountant’s monthly report.
- Menu Engineering (Sales Mix). Integration with Square, EPOS Now, Toast, and Lightspeed delivers item-level sales data in real time. The system shows which dishes are most popular and most profitable, which supports hold, switch, or re-price decisions by dish.
- Accounting Integration. One-click push of digitised invoices to Xero, with Sage integration coming soon. Jelly users report a 90% reduction in bookkeeping time.
- Flat-Rate Pricing. £129/month per location with no variable charge per user or feature.
- Fast Onboarding. Initial value from price alerts and spending insights appears within the first week, often within 24 hours of the kitchen photographing invoices into Jelly or suppliers sending invoices to a dedicated email address.
Jelly users cut food costs by 3% on average in the first 3 months and add 2 percentage points to gross margins. One operator improved gross profit from 65% to 72% within 12 weeks on approximately £500,000 in revenue.
“Price hikes were crushing our margins—I felt helpless. With Jelly, every dish cost is up-to-date at my fingertips. We slashed food costs by 5% in a month – it’s a game changer!” — Stuart Noble, Head Chef, Cairn Lodge Hotel
On a £500,000 annual food revenue base, a 3-percentage-point food cost reduction represents £15,000 returned to the bottom line. That saving comes from re-pricing decisions based on live invoice data rather than a spreadsheet from last quarter.
See How Jelly Tracks Your Dish Margins In Real Time
Frequently Asked Questions
How Often Should A UK Pub Re-Cost Its Menu?
Most UK pubs benefit from re-costing core dishes whenever key supplier prices move by around 5% or more. A quarterly review then catches slower shifts in costs and demand. Linking this review to live invoice data keeps the work focused on decisions rather than data entry.
Which Pricing Method Works Best For A Pub Burger?
Cost-plus or GP margin pricing usually sets the minimum viable burger price. Value-based and psychological pricing then adjust that price to reflect the pub’s brand, service level, and local competition. The right mix keeps the burger within target food cost while matching guest expectations.
How Can I Reduce Food Cost Without Damaging Perceived Value?
Start with portion control and plate design before cutting headline prices. Tight scales, clear recipe cards, and small changes to garnish or sides often recover several percentage points of food cost while guests still feel they receive the same experience.
What Is A Healthy GP% For A Mixed Food And Drink Pub?
Many mixed pubs aim for food GP in the mid-60s and drink GP in the low to mid-70s. The exact blend depends on format and rent. Tracking pound contribution per cover alongside GP% shows whether the mix of food and drink sales supports the overall profit target.
How Do I Bring Chefs And Finance Onto The Same Costing System?
Shared, simple dashboards usually work better than extra spreadsheets. Chefs need clear dish-level margins, while finance needs accurate invoice and GP data. A single system that pulls from invoices and POS gives both teams the same numbers and reduces friction.
Can Small Independent Pubs Benefit From A Menu Costing System?
Independent pubs with 30–50 dishes and frequent supplier changes often see the biggest gains. Even a few percentage points of recovered margin on a modest turnover can fund new staff, refurbishments, or debt reduction.
Conclusion: Turn Costing Into A Weekly Margin Decision
Accurate pub menu costing produces three core outputs that drive every pricing decision: net revenue ex-VAT, food cost %, and GP %. The burger example in this article, with one invoice price, one wastage allowance, and one VAT calculation, shows the foundation of every hold, switch, or re-price call a pub operator or head chef makes.
The UK Pub Benchmarks (2026) of 28–32% food cost, 68–72% GP, and 35% as a red flag only help when ingredient costs stay live. A static spreadsheet cannot provide that. A system connected to every scanned invoice can.
The next step is to see Jelly in action and watch invoice scanning, live dish costing, and real-time margin visibility working on your own menu.
Book A Live Jelly Walkthrough For Your Pub